
Therapeutic Index
The Therapeutic Index (TI) is used to compare the therapeutically effective dose to the toxic dose of a pharmaceutical agent. The TI is a statement of relative safety of a drug. It is the ratio of the dose that produces toxicity to the dose needed to produce the desired therapeutic response. The common method used to derive the TI is to use the 50% dose-response points, including TD50 (toxic dose) and ED50 (effective dose).
The Therapeutic Index (TI) is used to compare the therapeutically effective dose to the toxic dose of a pharmaceutical agent. The TI is a statement of relative safety of a drug. It is the ratio of the dose that produces toxicity to the dose needed to produce the desired therapeutic response. The common method used to derive the TI is to use the 50% dose-response points, including TD50 (toxic dose) and ED50 (effective dose).

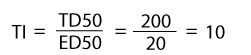
For example, if the TD50 is 200 and the ED50 is 20 mg, the TI would be 10.
A clinician would consider a drug safer if it had a TI of 10 than if it had a TI of 3 (Figure 1).
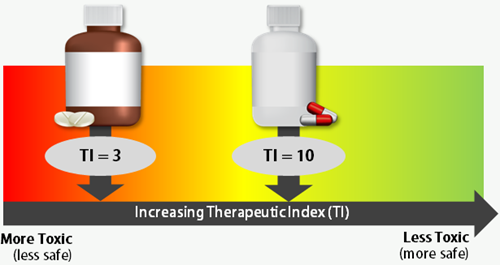
Figure 1. A higher value on the Therapeutic Index indicates a more favorable safety profile
(Image Source: ORAU, ©)
(Image Source: ORAU, ©)
However, the use of the ED50 and TD50 doses to derive the TI may be misleading about a drug's safety, depending on the slope of the dose-response curves for therapeutic and toxic effects. To overcome this deficiency, toxicologists often use another term to denote the safety of a drug: the Margin of Safety.
Margin of Safety (MOS)
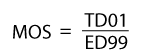
The Margin of Safety (MOS) is usually calculated as the ratio of the toxic dose to 1% of the population (TD01) to the dose that is 99% effective to the population (ED99).
Margin of Safety (MOS)
The Margin of Safety (MOS) is usually calculated as the ratio of the toxic dose to 1% of the population (TD01) to the dose that is 99% effective to the population (ED99).
The graph in Figure 2 shows the relationship between effective dose response and toxic dose response. The shaded area represents the doses at which the substance produces an effective dose response while the toxic dose response remains below the TD50. The slope of a curve shows how dose increases result in responses to the effective or toxic dose.
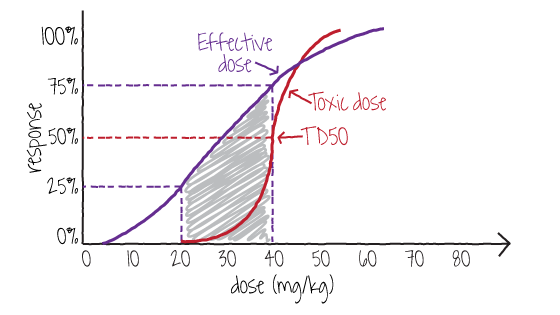
Figure 2. Relationship between effective dose response and toxic dose response
(Image Source: NLM)
(Image Source: NLM)
Because of differences in slopes and threshold doses, low doses may be effective without producing toxicity. Although more patients may benefit from higher doses, that is offset by the probability that toxicity will occur.
The toxicity of various substances can be compared using the slopes for each curve (Figure 3).
The toxicity of various substances can be compared using the slopes for each curve (Figure 3).
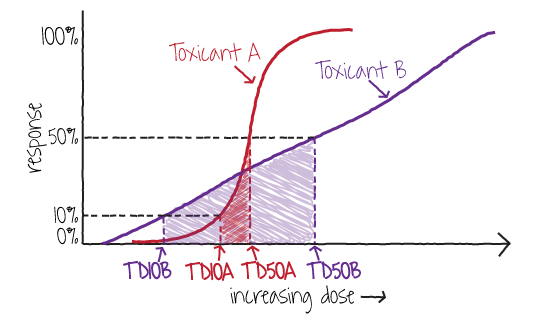
Figure 3. Comparison of the toxicity of two substances
(Image Source: NLM)
(Image Source: NLM)
For some substances, a small increase in dose causes a large increase in response, which is seen in Toxicant A's steep slope. For other substances, a much larger increase in dose is required to cause the same increase in response, as indicated in Toxicant B's shallow slope.